Journal of Biomedical Optics, Vol. 29, Issue S1
Tamar Harary, Michael Nagli, Nathan Suleymanov, Ilya Goykhman, Amir Rosenthal
Abstract:
Significance
Optical-resolution optoacoustic microscopy (OR-OAM) enables label-free imaging of the microvasculature by using optical pulse excitation and acoustic detection, commonly performed by a focused optical beam and an ultrasound transducer. One of the main challenges of OR-OAM is the need to combine the excitation and detection in a coaxial configuration, often leading to a bulky setup that requires physically scanning the ultrasound transducer to achieve a large field of view.
Aim
The aim of this work is to develop an OR-OAM configuration that does not require physically scanning the ultrasound transducer or the acoustic beam path.
Approach
Our OR-OAM system is based on a non-coaxial configuration in which the detection is performed by a silicon-photonics acoustic detector (SPADE) with a semi-isotropic sensitivity. The system is demonstrated in both epi- and trans-illumination configurations, where in both configurations SPADE remains stationary during the imaging procedure and only the optical excitation beam is scanned.
Results
The system is showcased for imaging resolution targets and for the in vivo visualization of the microvasculature in a mouse ear. Optoacoustic imaging with focal spots down to 1.3μm, lateral resolution of 4μm, and a field of view higher than 4 mm in both lateral dimensions were demonstrated.
Conclusions
We showcase a new OR-OAM design, compatible with epi-illumination configuration. This setup enables relatively large fields of view without scanning the acoustic detector or acoustic beam path. Furthermore, it offers the potential for high-speed imaging within compact, miniature probe and could potentially facilitate the clinical translation of OR-OAM technology.

In vivo MIP images of a portion of a mouse ear. (a) Region of interest of 4.2×3mm2 is highlighted in orange frame. (b) An MIP image corresponding to the FOV marked in orange obtained using trans-illumination configuration. (c) Region of interest of 2.5×5mm2 marked in green. (d) An MIP image corresponds to the FOV marked in green obtained using trans-illumination setup. A small part of the capillary network is enlarged on the right of the full image. (e) Magnified view of a 1D scan of two capillaries, indicated by a white dashed line is demonstrated to showcase the system resolution capabilities. (f) Region of interest of2×3mm2 marked in blue. (g) An MIP image corresponds to the FOV marked in blue obtained using epi-illumination setup.
Read more: Journal of Biomedical Optics, Vol. 29, Issue S1
Tamar Harary, Michael Nagli, Nathan Suleymanov, Ilya Goykhman, Amir Rosenthal

 Fig. PA image of (a) water acquired by 1930-nm OR-PAM and b lipid acquired by 1750-nm OR-PAM; c Overlaid PA image of (a) and (b). d Photography of the adipose tissue. e–f Three-dimensional rendering view of (a, b). Scale bars, 500 µm


 The study was supported by the Russell Berrie Nanotechnology Institute (RBNI), the National Science Foundation, the Polak Foundation, the Israel Innovation Authority, the Israel Science Foundation and the Ollendorf Minerva Center.
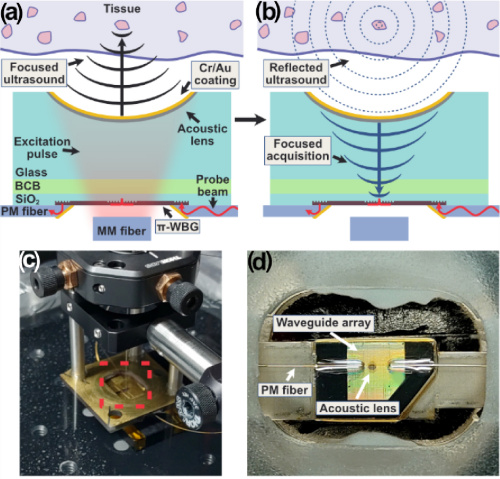
 Fig. Imaging experiments. (a),(c) Optical images of acoustic targets. (b),(d) Ultrasound images of the targets shown in panels (a),(c). (a),(b) Images of 50-µm tungsten wires. (c),(d) Images of lamb meat and fat tissue; (d) is a 1D line scan image along the dotted line shown in panel (c); on the right side are three 0.5 mm × 0.5 mm close-up images. The image in panel (d) is “rolled” and shown in the polar coordinate system.

 Fig. In-vivo Tomographic imaging. Figure 8-a: Microscope images of mouse ear (left) and corresponding MIP of the optoacoustic image (right). Figure 8-b: Montage of four different tomographic depth. The depth difference between each consecutive slice was 50 μm. Figure 8-c. Typical raw OA signals from a mouse ear. Scale bar: 1 mm
 Figure-Optoacoustic images of the blood vessels in a human wrist, at different depths and orientations. A cross-section of the radial artery can be seen clearly in real time at depths up to 7 mm, as in (a,c). A deep vein can be seen in (b) at a depth of 8 mm. In (d), we can see a vein diving from 3 to 7 mm in a longitudinal cross-section. The scale bar in subfigure (a) applies to all subfigures.

 Fig. PTAM pressure measurements. (a) Transmission spectrum of π-BG at different static pressures. The legend notes the pressure in kPa. (b) Normalized power transmission, (c) peak transmission, (d) resonance width, and (e) resonance wavelength of π-BG at different pressure calculated from the spectrum plotted in panel (a). (f) Schematic configuration of simultaneous ultrasound signal detection. Ultrasound signal, generated by a transducer, impinges the detection array at an angle. The setup results in a slight delay difference of the ultrasound signal along the detector array. (g) and (h) Measured ultrasound signals of the setup in panel (f), for resonators presented in Figs. 1(e) and 1(f), respectively.

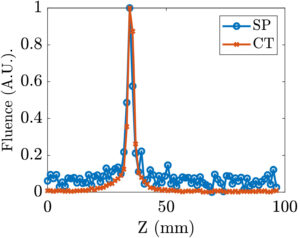
 Fig. A is a photograph of the leg. B is a subset over a vertical line of the measured signals, C is the de-multiplexed signals, and D is the MAP of the reconstructed optical density as a function of depth (z). The amplitudes are in arbitrary units.